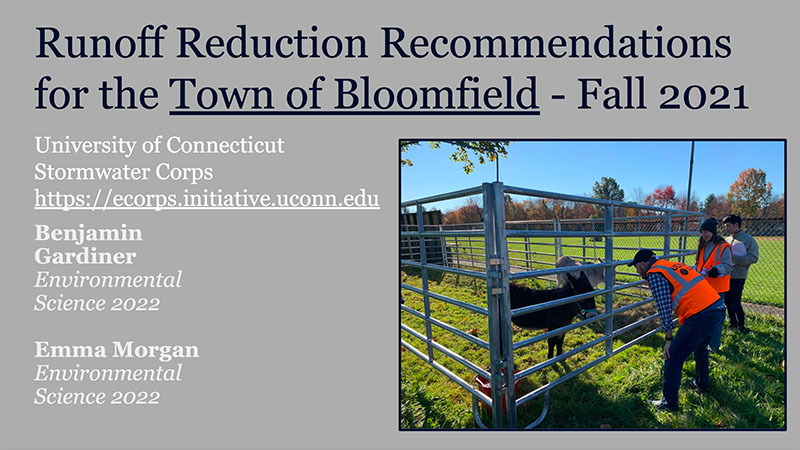
Project Team
Date: Fall 2021
UConn Students: Benjamin Gardiner, Emma Morgan
UConn CLEAR: David Dickson, Michael Dietz
The Runoff Reduction Report
This report includes recommendations for green stormwater infrastructure practices at 5 sites in the town of Bloomfield. Each site is displayed with an ArcGIS map of the recommended practice, detailed description of our recommendations, and an informational table. Each table shows an estimated drainage area, our recommended green infrastructure, annual gallons of runoff treated, nitrogen and phosphorus pollution reduction amounts, and the suggested size of each practice. These estimations were calculated based on the drainage area, annual rainfall estimates specific to Connecticut, and literature export values.
Report

GSI Summary Table
The following calculations display the potential pollutant-reducing benefits if the practices identified within the report were implemented:
| Site | Location | GSI Suggestion | Drainage Area (sq. ft.) | Annual Gallons Treated | Annual Nitrogen Reduction (lb. N/yr) | Annual Phosphorous Reduction (lb. P/yr) | Suggested Practice Size [6 in. depth] (sq. ft.) |
|---|---|---|---|---|---|---|---|
| 1 | Town Hall | Rain Garden 1 | 3,200 | 84,870 | 0.88 | 0.11 | 535 |
| Rain Garden 2 | 2,395 | 63,080 | 0.66 | 0.08 | 400 | ||
| Rain Garden 3 | 12,110 | 318,850 | 3.32 | 0.42 | 2,010 | ||
| 2 | Police Department | Rain Garden | 3,223 | 84,870 | 0.883 | 0.112 | 535 |
| 3 | Bloomfield High School | Rain Garden 1 | 10,670 | 281,000 | 2.93 | 0.37 | 1,770 |
| Rain Garden 2 | 1,090 | 280,990 | 0.30 | 0.03 | 180 | ||
| Rain Garden 3 | 5,050 | 133,000 | 1.38 | 0.17 | 840 | ||
| Rain Garden 4 | 4,500 | 118,000 | 1.23 | 0.16 | 740 | ||
| Rain Garden 5 | 5,620 | 147,950 | 1.54 | 0.20 | 930 | ||
| Rain Garden 6 | 6,000 | 158,300 | 1.65 | 0.21 | 1,000 | ||
| Rain Garden 7 | 2,900 | 75,700 | 0.79 | 0.10 | 480 | ||
| 4 | Carmen Arace Middle School | Rain Garden 1 | 7,000 | 160,500 | 1.67 | 0.23 | 1,000 |
| Bioretention Area | 21,080 | 555,000 | 5.77 | 0.78 | 875 | ||
| Rain Garden 2 | 2,500 | 65,375 | 0.68 | 0.09 | 450 | ||
| 5 | Metacomet Elementary School | Rain Garden 1 | 11,200 | 294,800 | 3.07 | 0.42 | 1,860 |
| Rain Garden 2 | 7,015 | 184,650 | 1.92 | 0.42 | 1,165 |
Totals
| Total IC Disconnected (sq. ft.) | Annual Gallons Treated | Annual Nitrogen Reduction (lb. N/yr) | Annual Phosphorous Reduction (lb. P/yr) | |
|---|---|---|---|---|
| Total | Over 104,600 | Over 3,000,000 | 26 | 6.5 |