Project Team
Date: Fall 2020
UConn Students: Tyler Metsack, Sarah Schechter
UConn CLEAR: David Dickson, Michael Dietz
The Runoff Reduction Report
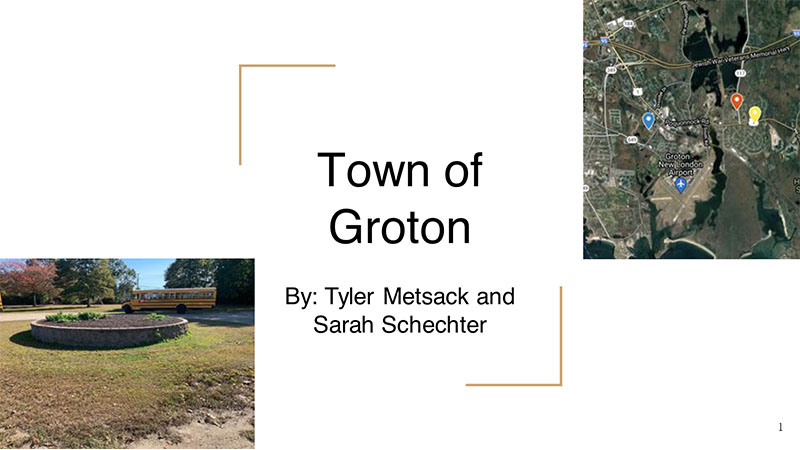
This report includes recommendations for green stormwater infrastructure practices at 4 sites in the Town of Groton. Each site is displayed with an ArcGIS map of the recommended practice, detailed description of our recommendations, and an informational table. Each table shows an estimated drainage area, our recommended green infrastructure, annual gallons of runoff treated, nitrogen and phosphorus pollution reduction amounts, and the suggested size of each practice. These estimations were calculated based on the drainage area, annual rainfall estimates specific to Connecticut, and literature export values.
Report

GSI Summary Table
The following calculations display the potential pollutant-reducing benefits if the practices identified within the report were implemented:
| Site | Location | GSI Suggestion | Drainage Area (sq. ft.) | Annual Gallons Treated | Annual Nitrogen Reduction (lb. N/yr) | Annual Phosphorous Reduction (lb. P/yr) | Suggested Practice Size [6 in. depth] (sq. ft.) |
|---|---|---|---|---|---|---|---|
| 1 | Senior Center / Public Library | Rain Garden 1 | 8,493 | 33,976 | 2.32 | 0.2947 | 704 |
| Rain Garden 2 | 8,886 | 35,544 | 2.43 | 0.308 | 783 | ||
| 2 | Public Housing Authority | Pervious Paving / Precast Slabs | 20,865 | 83,460 | 5.71 | 0.724 | 15,071 |
| 3 | Poquonnock Plains Park | Speed Bump / Grass Swale | 8,145 | 43,560 | 2.98 | 0.378 | 1,352 |
| Plastic Grid 1 | 40,075 | 43,560 | 2.98 | 0.378 | 17,380 | ||
| Plastic Grid 2 | 40,075 | 43,560 | 2.98 | 0.378 | 39,639 | ||
| Rain Garden | 13,854 | 55,408 | 3.79 | 0.48 | 1,150 | ||
| 4 | Town Hall Annex / Police Station | Biorention Basins | 317,814 | 1,270,209 | 86.9 | 11.02 | 52,713 |
Totals
| Total IC Disconnected (sq. ft.) | Annual Gallons Treated | Annual Nitrogen Reduction (lb. N/yr) | Annual Phosphorous Reduction (lb. P/yr) | |
|---|---|---|---|---|
| Total | 418,130 | 1,522,157 | 3103.38 | 13.20 |